WHAT IS A FALSE BREAKOUT?
At times, a financial asset like currency pair, commodity, exchange-traded fund (ETF), and stocks trade within a narrow range. During this period, they form a parallel support and resistance level.
In this case, a trader can make money by buying at the support and shorting at the resistance. However, always, it reaches a point where the price breaks either the support or the resistance and starts a new trend.
A breakout is when it does this. However, at times, after the breakout, the price tends to reverse. This reversal is known as a false breakout.
How it appears in charts
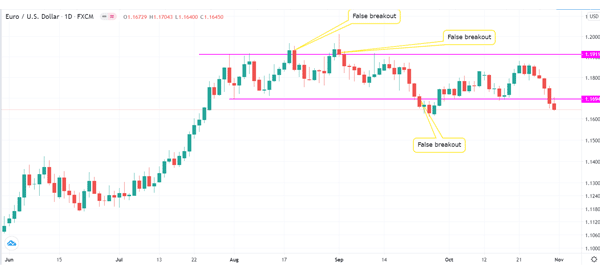
In the chart below, we see that the EUR/USD pair was in a relatively narrow range, with parallel support and resistance levels. We also see that there were at least three false breakouts when the channel was being formed.
example of false breakout
WHEN THE FALSE BREAKOUT HAPPENS
Ideally, a false breakout happens when there are no enough bulls or bears to continue supporting the asset. In the example above, the lower false breakout happened when bears found strong resistance from bulls.
Similarly, the upper false breakouts happened because there were no enough bulls to continue pushing the price higher.
There are two primary types of a false breakout:
- Bull trap – This happens when the price crosses a key resistance and then pulls back after a short while.
- Bear trap – This happens in a bearish trend when the price moves below a key support and then returns to the channel.
HOW TO IDENTIFY A FALSE BREAKOUT
To be fair, identifying a false breakout is never easy. If it was, most day traders would be able to identify it and make more money. However, there are several approaches you can use to avoid being caught-up in such a situation.
Wait some days + 3% rule
First, you need to wait for a few days to confirm whether what has happened is a real breakout. While doing this may seem like a counterproductive thing to do, the reality is that it will see you avoid losing money through a false breakout.
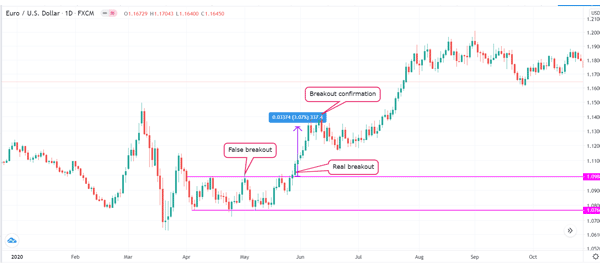
To do this, traders use the 3% rule, which means that the price needs to rise above the resistance level by 3% to confirm a breakout. A good example of this rule at work is shown below.
Look different timeframes
Another strategy of identifying a false breakout is looking at other timeframes. Ideally, if you spot a breakout in a shorter timeframe chart like four-hours, you can extend it to daily or weekly chart and see the overall trend.
If the price breaks down in a smaller timeframe chart but not in a longer timeframe chart, you can call this a false breakout.
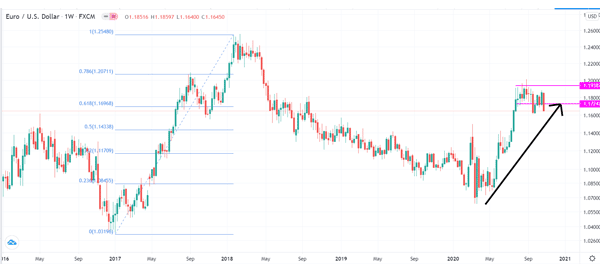
For example, in the first picture above, we see the EUR/USD attempting to break out lower on the daily chart. But, on the weekly chart, we see it still in consolidation – bullish flag – after a bullish run.
Also, we see that the price is between the 61.8% and 78.2% Fibonacci retracement level, which is a sign that bulls have just paused. This can be a sign that the lower breakouts are not real.
FINAL THOUGHTS
False breakouts happen all the time in the financial market. Whenever they do, most traders who don’t know much about them tend to lose a lot of money. Unfortunately, identifying these breakouts is not an easy task.
However, following the strategies we have mentioned can help you avoid making these mistakes.