WHAT IS MOMENTUM IN FINANCE?
The term momentum refers to a force that keeps an object moving after the trend has already started. In finance, it refers to a situation where the price of an asset continues moving in a certain direction. In most cases momentum tends to defy logic.
A good way to look at momentum is to identify some of the best-performing stocks in recent years. For example, at the time of writing, Tesla is worth almost $800 billion. This makes it the most valuable automaker in the world even though it sold about 500,000 cars in 2020.
In contrast, a company like Toyota sells more than 8 million cars every year. The reason why Tesla shares have performed so well is that there is momentum going on.
Another good momentum is Roku, the company that sells streaming devices. The firm is now worth more than $50 billion even though it generates more than $1.5 billion in profit and more than $100 million in losses.
This performance is primarily because of the perceived market size that Roku is looking up to and the fact that investors believe that it will dominate the television advertising industry.
The field of momentum is extremely large and highly-profitable. In fact, a look at historical performance shows that momentum traders make more money than other types of investors.
USING MOMENTUM IN TRADING
Day traders can use momentum in two primary ways.
Momentum Stocks
For one, stock traders can focus on momentum stocks since they tend to be extremely volatile. For example, since Tesla is always in the news, one can make more money trading it than General Motors (a blue-chip stock).
Similarly, one can make more money day trading a highly-volatile stock like Roku than a traditional company like News Corp.
Trend Following
Another way of using momentum is known as trend following. This is a situation where traders look at a stock or another asset and jump-in in its direction. For example, if the EUR/USD is rising, they can take advantage of the price action and buy the pair.
Similarly, if Nikola’s stock is falling, they can short it and make money as the price drops.
TOP MOMENTUM INDICATORS
An ideal way of trading using momentum is to use indicators. Fortunately, there are several indicators that can help you in this. For example, an indicator that is popular among momentum traders is the moving average.
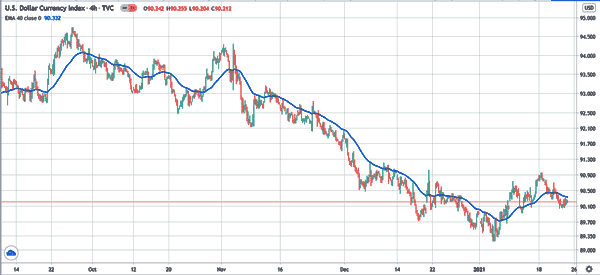
Ideally, traders use the moving average to identify when the momentum is losing steam. For example, in the chart below, we see that the dollar index is in a sharp downward trend. As a result, the ideal action is to place a short on the index and make money as the price falls.
The challenge many day traders have is that they don’t know when the momentum is nearing its end. Therefore, using the 40-day exponential moving average can easily show them when to exit the short trade, as shown below.
Using exponential moving average in momentum trading
Using the momentum indicator
Another popular indicators you can use to trade momentum is the momentum indicator that is available on most platforms like the MetaTrader and TradingView. The indicator appears like a single line that moves up and down below the chart. It basically measures the rate of change or speed of a financial asset.
As a result, by looking at this momentum, one can easily see whether the momentum will continue or whether it will change entirely. You can also use the indicator to identify divergencies and even continuations.
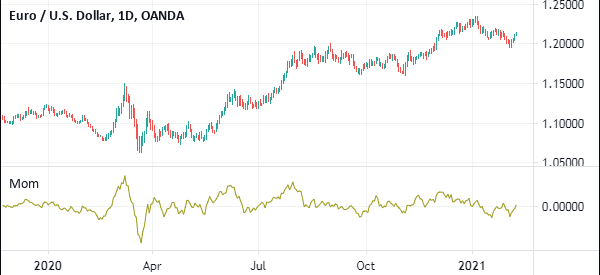
As shown in the EUR/USD chart below, the price continued to rise when the momentum indicator was above zero. This is known as the zero-line rule. In most cases, a sell signal will emerge when the price moves below the zero line.
The zero line plays a crucial role in the momentum trading, which dictates that you should buy when the momentum indicator crosses above the zero line and sell when it dips below it.
Why would you do that?
When the momentum indicator rises above the zero line, it means the price is trending upward, so it’s a good time to buy. When the indicator drops below the zero line, the price is trending downward, so you should sell.
Using the MACD in momentum trading
Another popular indicator you can use in momentum trading is the Moving Average Convergence Divergence (MACD). This is a relatively simple-to-understand indicator that converts two moving averages into an oscillator.
In most cases, the period of the fast moving average is 12 while the long MA is 26. The smoothing average used is 9.
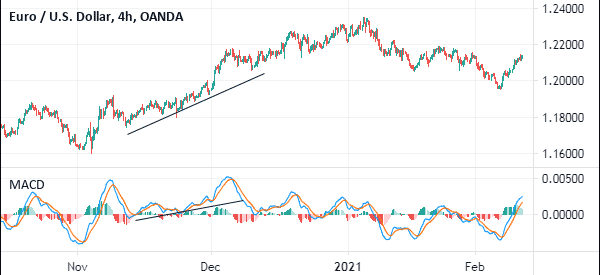
Therefore, you can use the MACD in momentum trading when the two main moving averages have a crossover. For example, if the price of an asset is in a bullish momentum and the two moving averages crossover, it is usually a sign that the momentum is waning and it is time to short.
Similarly, in a bearish trend, when the two lines crossover, it is usually a signal to go long. A good example of this action is in the EUR/USD chart shown below.
SUMMARY
Momentum is an important component of both day trading and long-term investing. It is an approach that works when used well. In day trading, we recommend that you identify some of the best momentum stocks and then come up with a strategy.
Also, you should learn more about support and resistance and momentum indicators.