WHAT IS GOLDEN CROSS IN TRADING?
This is a bullish signal that emerges when two moving averages make a crossover. The most common periods of the two moving averages are 50-day and 200-day moving averages.
Also, the strategy mostly uses the simple moving average indicator but some traders focus on the exponential, smoothed, and weighted moving averages.
The idea behind the golden cross is very simple. When the asset price starts to rise, it first meets the 50-day moving average. This happens as buyers start pushing the price higher with some staying in the side-lines.
Then, when the price manages to move above the 200 moving average, more buyers get convinced that this is, indeed, a bull run and then continue pushing the price higher.
Better periods for day traders
However, since the 50-day and 200-day moving averages are relatively wide for day traders, most of them have narrowed down the periods. Some will combine the 10 and 50-period moving averages while others will combine the 25-period and 50-period MAs.
Golden cross can be used in all types of financial assets, including currencies, stocks, indices, commodities, and exchange-traded funds (ETFs).
HOW GOLDEN CROSS FORMS
To understand how the cross forms, you first need to understand the concept of moving averages. A moving average is a technical indicator that is calculated by finding the average prices of an asset’s price.
There are several types of moving averages, including simple MA, exponential MA, weighted MA, and the smoothed MA. All of these are based on the same concept but have different formulas because of the need to remove or reduce the lag found in simple moving average.
For example, the exponential MA removes the lag by providing more weighting to recent prices while the WMA removes this lag by diluting the impact of early data.
The golden cross starts after a long period of downward trend in the price of an asset. As it starts to rebound, the price then moves above the shorter-time moving average and then moves to the longer-term average.
EXAMPLE OF A GOLDEN CROSS
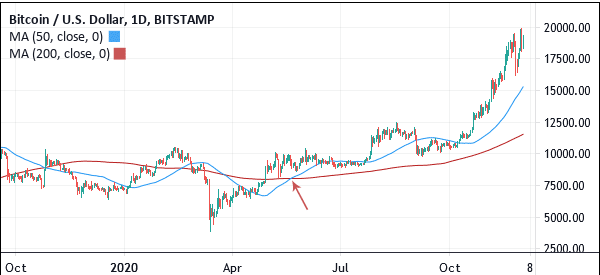
On the daily chart below, we see that that the price of Bitcoin continued to soar after moving above the 50-day and 200-day moving averages.
Golden cross with 50 and 200 MA. Chart from Tradingview
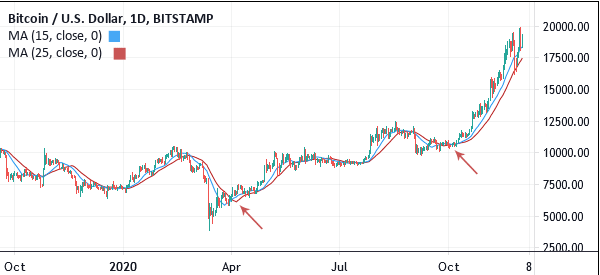
On the chart below, we have used a 15-day and 25-day moving average, which is a popular combination among day traders.
The same cross with 15 and 25 MA. Chart from Tradingview
GOLDEN CROSS VS DEATH CROSS
The opposite of golden cross is the death cross. It refers to a period when the shorter moving average (50 MA) moves below the 200-day MAs.
It starts after a bullish trend when the price moves below the shorter MA, in a signal that bears are returning. This is then followed by another cross of the longer MA. In most cases, this usually leads to a further decline of the asset price.
SUMMARY
A golden cross is an important trading strategy that uses a combination of longer and shorter moving averages.
Like all trading strategies, it has its challenges. For example, for day traders, using the 200-day and 50-day moving averages tends to be less effective. Therefore, we recommend that you experiment on several time combinations to see the one that works well for you.